
.png)

Context:
This project aims to reflect on my role and contributions working at 'The Ayurveda Experience', global D2C wellness brand with a market across USA, Canada and Australia. The brand operates with 97% of it's presence online and hence the role looked into platform optimization for an increased CVR and Revenue.
Impact:
Improve digital funnel performance by 27%, Reduce drop-offs, and boost conversions from 4% to 13% on an average.
UX Research
UX Design
My Role as a UX Researcher and Designer
-
Worked closely with product managers to turn business and research findings into scalable design improvements that now influence ongoing email and CRM initiatives.
-
Led design efforts across email and web, identifying friction points and shaping new US-focused design concepts aligned with cultural and regional user behaviors.
-
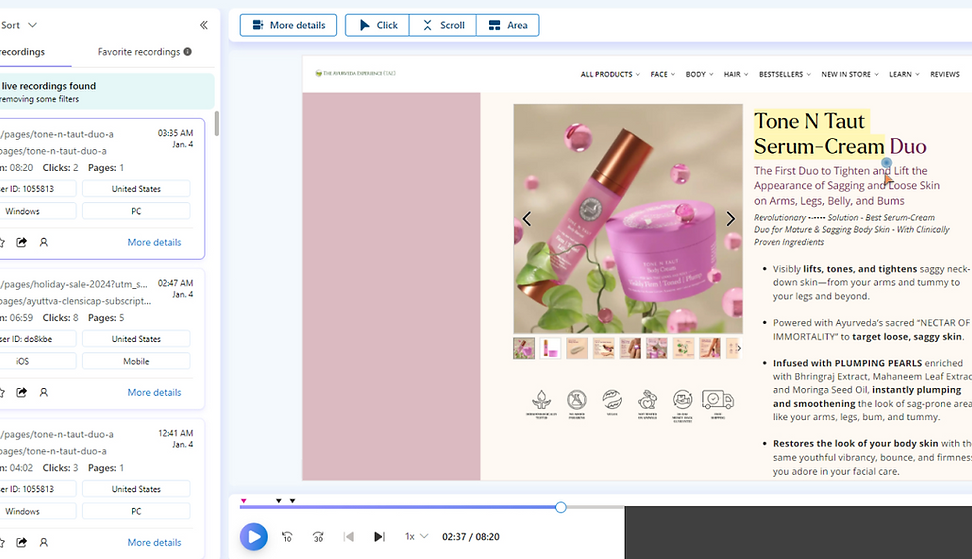
Conducting usability studies and behavioral analysis to uncover barriers in the user journey and inform UX and personalization strategies.
⚠️ Challenges:
1.
Low Conversion Rates despite
High Click Rate [CR]
2.
High Cart and
Checkout Abandonment
Current Conversion Rate
2-4%
Industry average 6-8%
Critical Funnel breakdown points
95%
Email Click Rate
Product View
Active Carts
68%
Purchase completed
8%
25%
⛔️ Impact: Significant revenue loss from existing traffic.
⛔️ Impact: 92% of interested users leave without purchasing
🔎Actionable Insights explored:
High-Traffic Optimization

Prioritize optimization on high-traffic sections to ensure clarity, speed, and relevance.
Simplified Transitions
Reduce drop-offs by simplifying transitions between stages and improving user flow.

Enhanced Conversions
Enhance conversions by streamlining checkout flows and addressing pain points revealed in the data.

Current Challenges
Low Conversion Rates despite High Click Rate [CR]
Current Conversion Rate
2-4%
Industry average 6-8%
⛔️ Impact: Significant revenue loss from existing traffic.
High Cart and
Check out abandonment
Critical Funnel breakdown points
Email Click Rate
Active Carts
⛔️ Impact: 92% of interested users leave without purchasing
✅ Boosting CVR to 13%
from 4% with User Research
Insights incorporated by behaviour studies through A/B testing to inform UX decisions
The drop-off points above reflect pain points such as unclear product information, lack of trust signals, or insufficient call to action's. Diving into active user engagement with Product Listings, to understand obstructions before purchase funnel.
🎯 OUTCOME
Increasing Conversion Rates from an average of 2-4% per page to 9-13% per page through strategic design optimizations.
✅ Spearheading new design directions and Tools
Spearheaded the development of new design concepts of engagement tailored for the US Geography product line, thus researching cultural nuances and user behaviours within the region to integrate micro interactions
🎯 OUTCOME
Sustained use of introduced tools for Customer Retention Management such as HTML/CSS integration for micro interactions and Microsoft Clarity to understand users


✅ Increasing 27%
Revenue for USA Platform
Led design assets and visualizations team for BFCM 2024 for Email channel
🎯 OUTCOME
Increase of 7% in EPS and 27% in Revenue as compared to previous year’s performance (2023)

Spearheading accessibility tests for the design team to ensure that all digital products meet inclusivity standards and provide an optimal experience
Black Friday-Cyber Monday (BFCM) Strategy Mapping - driving a +27% Revenue from our team